


Software infrastructure has a habit of accumulating things.
A temporary container deployed for testing. A background worker that survived a feature migration. A cron job nobody remembers setting up. An old database connection pool that still consumes resources.
Individually, these components might seem harmless. Some may run for months without anyone noticing.
But just because something isn't causing an obvious problem doesn't mean it isn't affecting the system.
The hidden cost of forgotten infrastructure
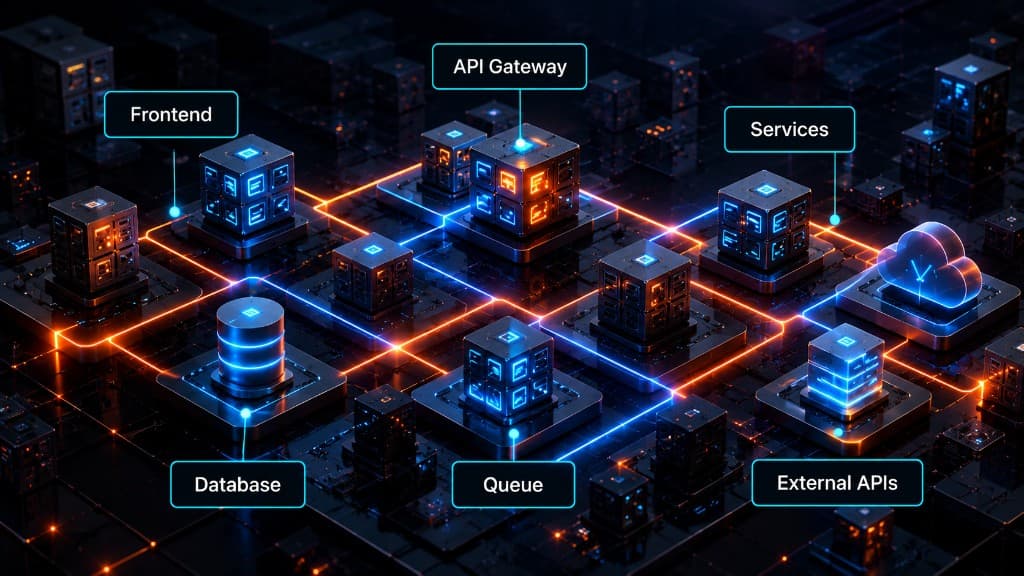
In modern software environments, applications rarely operate in isolation.
Services share computing resources, communicate through APIs, depend on databases, and interact with cloud infrastructure.
An unnecessary background process might consume only a small amount of CPU. A forgotten worker might maintain a few database connections. An outdated service might continue generating network traffic.
None of these necessarily causes an incident on its own.
But when multiple components compete for shared resources, the effects can accumulate:
- Resource contention: Unnecessary workloads compete with production services for CPU, memory, storage I/O, or network bandwidth.
- Unexpected dependencies: Older components may still communicate with active services, making changes and deployments riskier.
- Performance degradation: Resource pressure can increase latency and reduce throughput, particularly during peak demand.
- Operational complexity: Troubleshooting becomes harder when the actual infrastructure differs from what teams believe is running.
- Reliability risks: Under certain conditions, resource exhaustion or unexpected dependencies can contribute to wider system failures.
The challenge isn't simply that unused infrastructure exists.
It's that teams may no longer have an accurate understanding of their own systems.
Monitoring isn't the same as knowing what exists
Most engineering teams already monitor their infrastructure.
They track CPU utilization, memory consumption, request latency, error rates, and service availability.
These metrics are essential. But they don't necessarily provide a complete inventory of everything running across an environment.
Monitoring typically starts with a known set of resources.
What happens when a component isn't part of that known set?
A forgotten scheduled job may continue executing successfully. An old service might remain healthy while consuming resources unnecessarily. A legacy integration may still be active even though it no longer appears in the current architecture documentation.
Everything can look operationally healthy while the underlying architecture becomes increasingly difficult to understand.
This is where infrastructure discovery and dependency mapping become important complements to traditional observability.
Why infrastructure visibility becomes harder over time
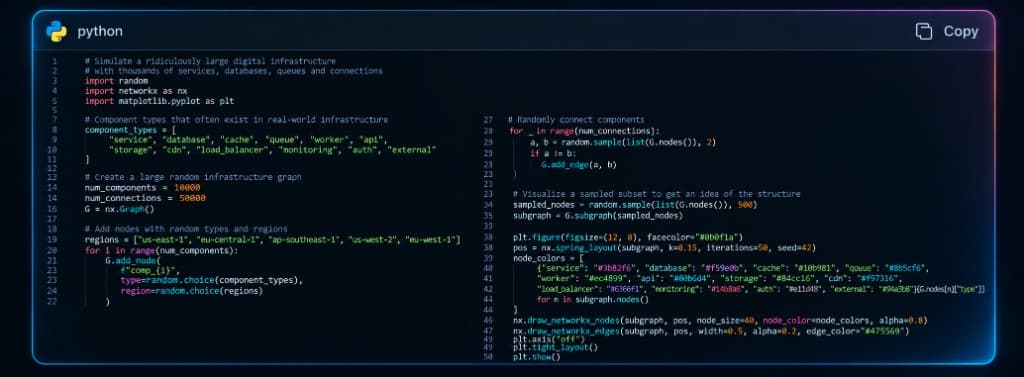
The problem tends to grow with the complexity of the system.
A small application might start with a repository, a backend service, and a database.
Over time, it gains additional services, cloud resources, automated deployments, background workers, external integrations, and development environments.
Different people deploy different components. Some services are replaced, while others remain. Documentation gradually becomes outdated.
Even with infrastructure-as-code and established deployment processes, discrepancies can emerge between the intended architecture and the actual running environment.
The result is a familiar engineering challenge:
The system you think you're operating isn't always the system that's actually running.
From static documentation to continuous discovery
Architecture diagrams and infrastructure inventories are useful, but they represent a system at a particular moment.
Modern software environments change continuously.
A more reliable approach combines several capabilities:
- Resource discovery: Identify services, workloads, repositories, databases, and infrastructure resources across connected environments.
- Dependency mapping: Understand how components communicate and depend on one another.
- Change detection: Recognize when resources appear, disappear, or change their relationships.
- Operational context: Connect discovered components with relevant metrics, ownership information, and deployment history.
- Continuous validation: Compare the observed environment with expected configurations and documented architecture.
No single discovery method provides perfect visibility. Source-code analysis, cloud inventories, orchestration APIs, runtime telemetry, and network observations each reveal different parts of a system.
Combining these perspectives can provide a more complete picture.
Visibility is the starting point
Forgotten infrastructure doesn't automatically cause performance problems.
But infrastructure that nobody knows about is difficult to evaluate, optimize, secure, or retire.
Before teams can decide which resources are unnecessary, which dependencies are risky, or where computing capacity is being wasted, they need to understand what actually exists.
That makes continuous infrastructure visibility more than a documentation exercise.
It's a foundation for operating increasingly complex software systems with confidence.
At SPECTRALE, we're exploring how automated software architecture discovery and visualization can help developers better understand the systems they build and operate.